Raman Spectroscopy

Raman Spectroscopy is a powerful analytical technique that explores molecular vibrations by measuring inelastic scattering of monochromatic light. It provides valuable insights into molecular structure, composition, and chemical bonding, making it widely used in material science, chemistry, and biology. The unique spectral fingerprints obtained through Raman spectroscopy enable non-destructive and precise identification of substances, making it a versatile tool for research and quality control applications.
Theory Behind Raman Spectroscopy
Raman spectroscopy is a spectroscopic technique based on Raman scattering. When a substance interacts with laser beam, almost all of the light produced is Rayleigh scattered light (elastic process). However, a small percentage (about 0.000001%) of this light is Raman scattered (inelastic process). Raman scattering is a process, where incident light interacts with molecular vibrations in a sample.
The photons from the laser beam interact with the molecules and excites the electrons in them. The excited electrons are in a “virtual state” which is not stable, so they immediately fall down to the ground level. As electrons lose energy and fall down to the ground state, they emit photons. There are three different scenarios of how light can be re-emitted after energy had been absorbed by an electron:
- An electron falls down to the original ground state and there is no energy change, therefore light of the same wavelength is re-emitted. This is called Rayleigh scattering.
- After being excited, an electron falls to a vibrational level, instead of the ground level. This means the molecule absorbed a certain amount of energy, which results in light being emitted in a longer wavelength than the incident light. This Raman scatter is called “Stokes”.
- If an electron is excited from a vibrational level, it reaches a virtual level with higher energy. When the electron falls down to the ground level, the emitted photon has more energy compared to the incident photon, which results in shorter wavelength. This type of Raman scatter is called “Anti-Stokes”.

Figure 1. (A) Molecular representation of light scattering in 3 different ways. (B) Energy diagram representing Rayleigh, Stokes, and Anti-Stokes scattering.
Understanding Raman Data
In any case of Raman scatter, the energy change relative to wavelength of the photons can be spectroscopically detected as a colour change and is characteristic to the sample being investigated. The output of Stokes and Anti-Stokes scatter measurements is called a Raman Spectrum.
In Raman spectroscopy, wavenumber (measured in cm-1) is used instead of wavelength to characterise light. Wavenumbers are convenient to use, because because they are linearly related with energy and independent of excitation wavelength. For example, the Raman peak of diamond is always at about 1332 cm-1, no matter what the excitation wavelength is. That is why every material has it’s own unique Raman spectrum by which it can later be identified.

Figure 2. Typical Raman spectrum of diamond with a single well-defined peak.
Since this process is non-destructive and does not require direct physical contact with the sample, it allows fast chemical analysis of solids, powders, liquids and gases. That is why Raman spectroscopy can be used for various applications, such as: carbon science, material analysis, microscopy, pharmaceutical, forensics, biology, food and many more. Because of the compactness of our lasers, they are a perfect fit for portable and hand-held Raman devices.
As Raman spectroscopy requires monochromatic light as an excitation source, it is best to use single longitudinal mode (narrow bandwidth) lasers for this application. Most often used wavelengths are: 405 nm, 488 nm, 532 nm, 633 nm, 785 nm, 830 nm, 1030 nm, 1064 nm.
Raman Spectroscopy During The Pandemic
Since March 2020 Raman Spectroscopy has attracted a lot of attention among scientists who joined the war against COVID-19. Raman or vibrational spectroscopy offers a powerful technique for observing molecular changes within analyte. Variations of the technique, such as SERS (Surface Enhanced Raman Scattering) or TERS (Tip Enhanced Raman Scattering) offer further insights into a low concentration or trace analysis.
It has been a while now since scientists started to demonstrate that Raman and various enhancement techniques can be successfully and efficiently applied for the detection of various types of viruses. Use of anti-Stokes Raman together with TERS:
https://arxiv.org/ftp/arxiv/papers/2003/2003.07951.pdf
With the outbreak of COVID-19, scientists paid extra attention to the utilization of various techniques, and Raman again attracted a lot of attention.
A group of s scientists in the Northern Arizona University received a grant to develop SERS substrates as a testing aid for fast COVID-19 detection:
https://www.news-medical.net/news/20200515/Interdisciplinary-team-to-develop-a-new-physics-based-technology-for-COVID-19-detection.aspx
Another group from Beihang University published a database of Raman spectra of COVID-19 infected and healthy patients and intend of using SERS enhancement technique together with machine learning to analyze these samples:
https://springernature.figshare.com/articles/Data_and_code_on_serum_Raman_spectroscopy_as_an_efficient_primary_screening_of_coronavirus_disease_in_2019_COVID-19_/12159924
A group led by Mauricio Terrones from Pennsylvania State University is researching the detection of viruses trapped between carbon nanotubes in a microfluidic device for saliva or a blow-through device. The ultimate goal is to use machine learning in order to digest the complex spectral information and enable fast identification and good accuracy, a combination, which is not offered by the methods which are currently in use:
https://www.fastcompany.com/90502250/im-a-scientist-we-should-try-testing-for-covid-19-using-laser-beams
Horiba cooperates with the University Hospital of Montpellier aiming to establish a Raman-based screening of CRP inflammatory marker, trying to quickly determine the condition of an infected patient in terms of how urgent hospitalization is needed and where only homecare is needed:
https://www.horiba.com/en_en/products/by-segment/medical/hematology-analyzer/coronavirus-covid19/
Authors from the Tsinghua University, the Research Institute for Environmental Innovation, and the Chinese Academy of Sciences have published a scientific paper about using nano-rod silver SERS substrates for the detection of COVID-19 in the environment. The achievement promises good perspectives in developing fast and accurate screening tool, which would help to fight COVID-19 pandemic:
https://www.medrxiv.org/content/10.1101/2020.05.02.20086876v1.full.pdf
Integrated Optics supplies continuous-wave (CW), single-longitudinal mode (SLM) lasers with all the relevant wavelengths for a competitive price, they can be found in our website. Because Raman signal is quite weak, one of the ways to enhance the intensity is SERS (Surface-Enhanced Raman Spectroscopy). SERS substrates are made by our partner Ato ID and can be found in our website as well.
Relevant Products
785 nm SLM Laser
Spectral line width FWHM, MHz: 2
Output power, mW: 125
Power stability, % (RMS, 8 hrs): 0.02
Intensity noise, % (RMS, 20 Hz to 20 MHz): 0.15

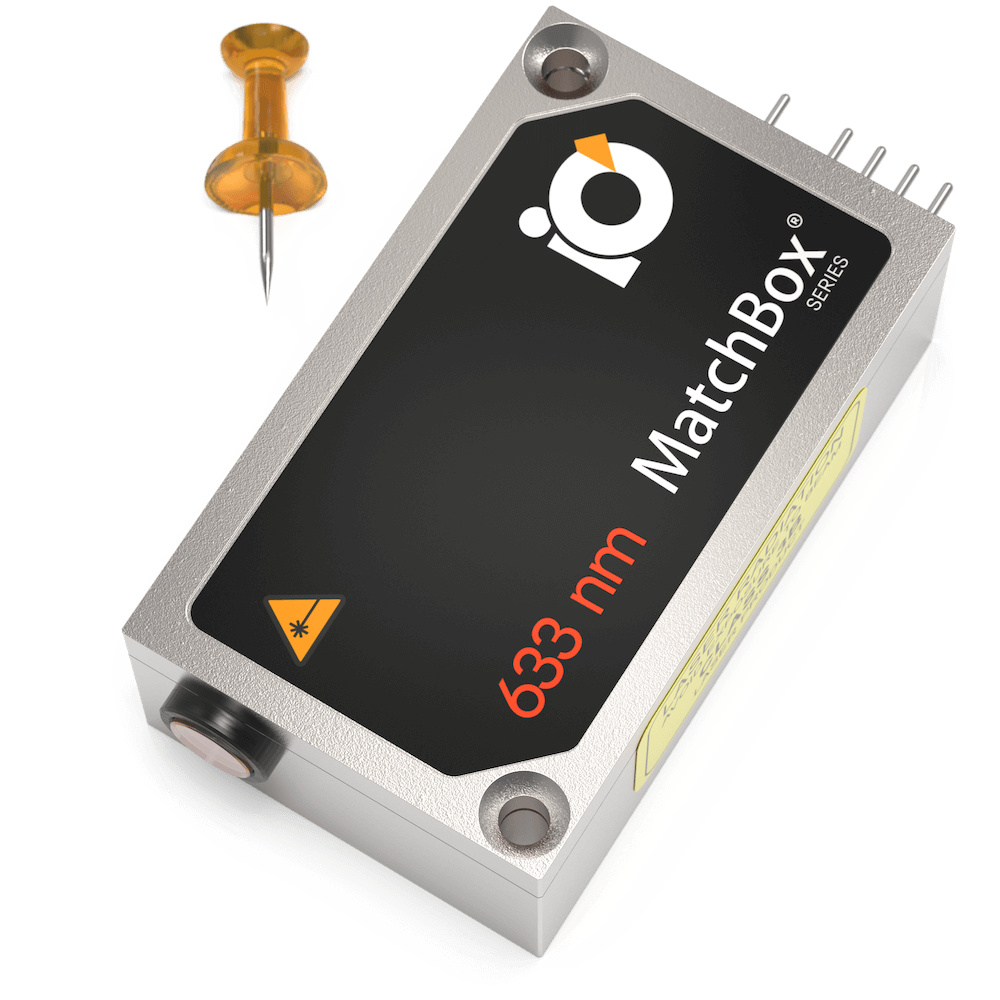
633 nm SLM Laser
Spectral line width FWHM, MHz: 2
Output power, mW: 70
Power stability, % (RMS, 8 hrs): 0.03
Intensity noise, % (RMS, 20 Hz to 20 MHz): 0.2

830 nm SLM Laser
Spectral line width FWHM, pm: 0.1
Output power, mW: 100
Power stability, % (RMS, 8 hrs): 0.02
Intensity noise, % (RMS, 20 Hz to 20 MHz): 0.2

1030 nm SLM Laser
Spectral line width FWHM, MHz: 2
Output power, mW: 400
Power stability, % (RMS, 8 hrs): 0.1
Intensity noise, % (RMS, 20 Hz to 20 MHz): 1.5

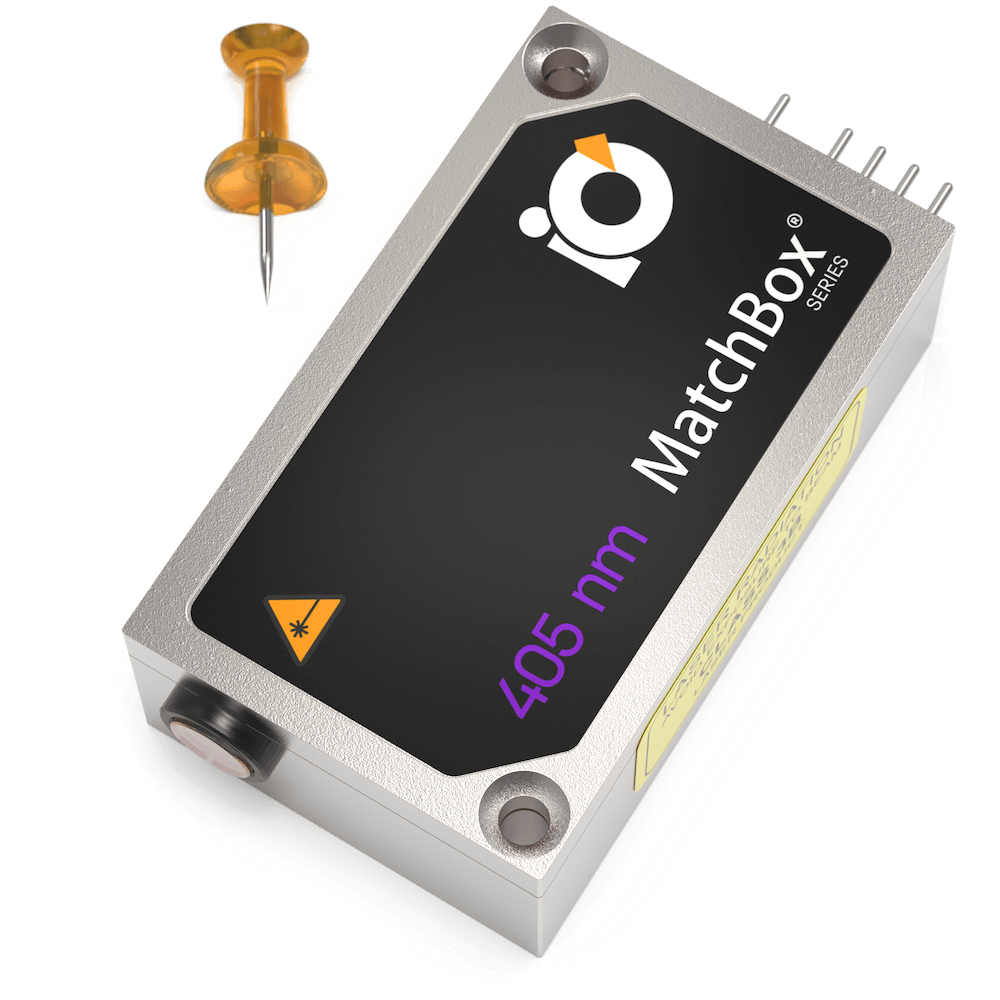
405 nm SLM Laser
Spectral line width FWHM, MHz: 20
Output power, mW: 50
Power stability, % (RMS, 8 hrs): 0.05
Intensity noise, % (RMS, 20 Hz to 20 MHz): 0.2

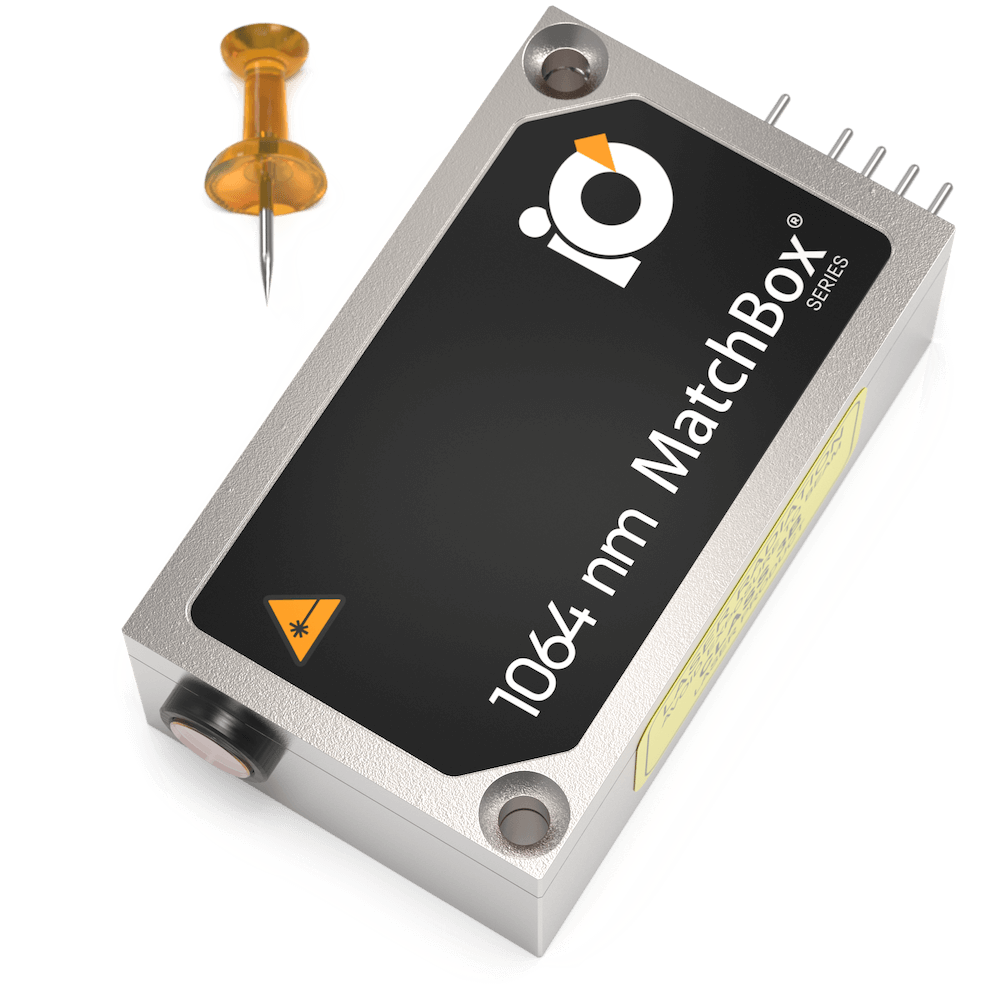
1064 nm SLM Laser
Spectral line width FWHM, MHz: 0,64
Output power, mW: 400
Power stability, % (RMS, 8 hrs): 0.1
Intensity noise, % (RMS, 20 Hz to 20 MHz): 1

Publications
Nature Nanotechnology:
The FEBS Journal:
Journal of Raman Spectroscopy:
Nature: Light-Science & Applications:
Nanomaterials:
Sensors:
Analyst:
Biomolecules:
Analytical Chemistry:
- Profiling of Unsaturated Lipids by Raman Spectroscopy Directly on Solid-Phase Microextraction Probes
Dyes and Pigments:
Protein Science:
Materials:
- Towards N–N-Doped Carbon Dots: A Combined Computational and Experimental Investigation
- Formation of Citrazinic Acid Ions and Their Contribution to Optical and Magnetic Features of Carbon Nanodots
Advanced Photonics Research:
ACS: The Journal of Physical Chemistry C:
Spectrochimica Acta Part A: Molecular and Biomolecular Spectroscopy:
ACS: Sensors:
Diamond and Related Materials:
ACS: Applied Materials & Interfaces:
Sustainable Energy & Fuels:
Crystals:
Applied Organometallic Chemistry:
Journal of Inorganic Biochemistry: