Super-resolution Microscopy
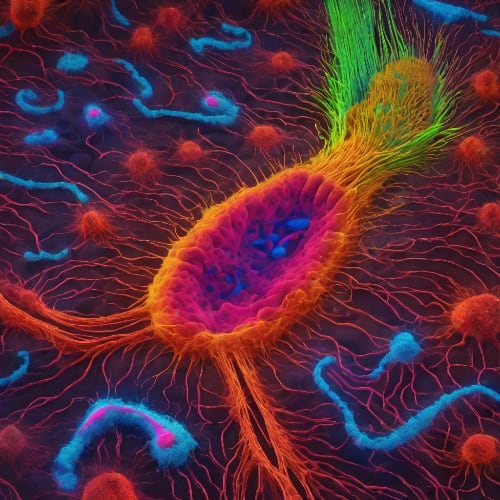
Traditional microscopy methods have served researchers for decades. Most conventional microscopes can image at resolutions between 1µm and 250nm which is sufficient to observe cellular dynamics and many internal structures. However, the necessity to discern finer details and develop new molecular based therapeutics has lead to the field of Super-Resolution Microscopy.
At resolutions below 250nm in the x-y plane, and 500nm along the z axis, conventional microscopy becomes confined by the diffraction limit, dictated by the Rayleigh Criterion. It defines the minimum resolvable distance between two adjacent points in an image. This limit arises due to the wave nature of light, leading to the spreading of light as it passes through an aperture. Beyond the diffraction limit, objects closer than half the wavelength of light used for imaging become indistinguishable (Figure 1). Because of this, the effective maximum resolution attainable by conventional methods is ~200nm.

Figure 1. The signal intensity of A and B is indistinguishable because the intensity peaks are too close to each other.
Understanding the role of Numeric Aperture and the Point Spread Function:
Such resolution is only attained under optimal conditions, which are influenced by factors such as the numeric aperture (NA) and the point spread function (PSF) of the imaging system. The NA, a dimensionless quantity, is a measure of the range of angles over which the system can accept or emit light. It is directly related to the resolving power of an optical system, with a greater NA allowing for better resolution. On the other hand, the PSF describes the response of an imaging system to a point source or point object. It represents the distribution of light from a single point source in the object plane, and its width gives an indication of the image quality. The narrower the PSF, the higher the optical resolution. However, these parameters are not independent - the point spread function is influenced by the numeric aperture and the wavelength of light, linking back to the confounding variable: the diffraction limit. Super-Resolution Microscopy overcomes these limitations through two approaches: Ensemble Measurements and Single Molecule Measurements (SMMs), to achieve resolutions of up to 10nm.
Single Molecule Measurements:
SMM microscopy involve the precise localization of individual fluorophores that are attached to the subject (cell wall, organelle, protein, etc.), enabling the study of biological structures at greater detail. A sparse subset of fluorophores is sequentially activated and deactivated, and their positions are precisely determined through the emitted photons, creating a super-resolved image. The two main techniques are Stochastic Optical Reconstruction Microscopy (STORM) and Photoactivated Localization Microscopy (PALM), both precisely localize individual fluorophores, allowing researchers to study molecular and cellular details at the single-molecule level.
PALM and STORM:
PALM operates on the principle of sequential activation and time-resolved localization of photoswitchable fluorophores to generate high-resolution images. It capitalizes on the ability of certain fluorophores to switch between active and inactive states, allowing for sequential activation and deactivation (Figure 2). The process involves activating only a sparse subset of fluorophores at a time, capturing their individual positions with high precision and then photobleaching them. By repeatedly cycling through this activation-deactivation process and recording the emitted photons, the specific coordinates of each fluorophore are determined. This localization information is then used to reconstruct a super-resolved image, maintaining all the relative positions of the fluorophores and hence, the structure of the imaged object.

Figure 2. Illustration of Photoactivation followed by Emission of a photoactivatable fluorophore. First, the nonemissive fluorophore is photoactivated with light. It then switches to an emissive state. Lastly, light of different wavelength than that used for photoactivation excites the fluorophore which leads to emission.
STORM utilizes the same imaging and reconstruction technique but differs from PALM by the types of fluorescent molecules used. It relies on organic dyes that stochastically flicker when subjected to the right chemical conditions. These fluorophores exhibit high brightness, a high rate of photoblinking, and minimal photobleaching. In PALM the photoswitchable fluorophores are fluorescent proteins that are expressed together with (and therefore connected to) the protein of interest. STORM, however, uses fluorophores linked to antibodies that would exclusively attach to that structure. Regardless, in both cases this precise localization of these fluorophores is the cornerstone of achieving super-resolution.
Ensemble Measurements:
Like SMMs, Ensemble Measurements also utilise fluorophores to resolve structures below 200nm. However, their distinguishing approach involves the illumination aspect of the sample, specifically shaping the illuminating beam to capture these finer details. The goal is to optically reduce the diameter of the PSF, allowing for the discernment of details that would otherwise remain obscured. In the case of Super Resolution Structured Illumination Microscopy (SR-SIM), this is achieved by introducing non-uniform excitation light patterns, altering the orientation and angle of the grid pattern illuminating the sample. Stimulated Emission Depletion (STED) achieves PSF narrowing by creating two zones: the central region excites the fluorophore of interest, while the doughnut-shaped area around the centre actively suppresses fluorescence. Both methods of shaping incident light facilitate detail acquisition beyond the diffraction limit.
Stimulated Emission Depletion:
In STED microscopy, a technique called spatially patterned excitation is used. This method relies less on mathematical models to reconstruct sub-diffraction limit details, from diffraction limited images like in SMMs. Its success is contingent on the excitation and STED lasers, and the effective narrowing of the PSF.
Narrowing of the effective PSF involves an excitation and a depletion (STED) lasers to form a doughnut-shaped pattern. The excitation laser functions as discussed in the section on Fluorescence Microscopy. It excites all the fluorophores in the region of illumination. The STED light is simultaneously beamed at the same location, however, it first passes through a phase mask, which creates a doughnut pattern at the objective focal point. The combined result is a narrow excitation point at the very centre surrounded by a saturated depletion zone (Figure 3A). Because of this, fluorescence happens only at the very centre, and is suppressed around it.
Depletion occurs in the following way. Firstly, all the fluorophores are excited to a higher vibrational level of S1. Then, they transition down to the lowest vibrational level of S1 (before emission). At this moment the fluorophores are susceptible to depletion through a process called stimulated emission. Before fluorescence takes place photons strike the fluorophore preventing transition to the lowest vibrational level of S0. Instead, the molecule transitions to a higher vibrational level of S0. The energy available between the ground state of S1 and a higher vibrational level of S0 is smaller than the difference between both ground states (Figure 3B). This means the photon emitted as a product of Stimulated Emission will be of lower energy and in consequence of longer wavelength (red-shifted) relative to the photon emitted by Fluorescence. This red-shift enables discrimination between the signal coming from excitation, and the noise from the saturated depletion zone. The end result is an effectively narrower PSF enabling super resolution imaging.

Figure 3. (A) Patterns used in STED to obtain a narrow excitation zone. (B) Visualization of Stimulated Emission compared to Fluorescence.
Super Resolution Structured Illumination Microscopy:
SR-SIM uses grid projections to increase the resolution limit. These projections are cast on the sample at different phases and orientations. The subsequent fluorescent signal emitted from the sample is detected. The high-frequency information is extracted and reconstructed in the Fourier domain to produced the final image.
The initial step involves passing the laser light through a polariser. This polarization control is crucial for achieving optimal interference patterns during the structured illumination process. Polarized light then passes through a diffraction grating. The grating disperses the incident light into different diffraction orders based on the wavelength and angle of incidence. In SR-SIM, the -1, 0, and +1 diffraction orders are specifically chosen for further processing. These diffraction orders are directed onto the objective's rear aperture. The -1 and +1 orders represent the first-order sidebands, and the 0 order represents the undiffracted light. The interference between these selected orders creates a sinusoidal pattern when they converge at the specimen plane. The reason for using these specific diffraction orders is to generate structured illumination with well-defined interference patterns. This process is repeated, changing the orientation of the grid each time.
The specimen, labelled with fluorophores, interacts with this patterned light at different phase orientations. Consequently, interference occurs between the structured illumination and the sample frequencies. This gives rise to a third pattern called Moiré fringes (Figure 4). These fringes contain information about the sample that is encoded at a higher spatial frequency than can be resolved by conventional microscopy. This information is reconstructed in the Fourier domain. Fourier analysis separates the high-frequency components (originally from the sample but encoded into the Moiré fringes) from the low-frequency components (originating from the patterned illuminating light). The end result allows reconstruction of the sample space at super-resolution.

Figure 4. Illustration of Moiré fringes. θ is the angle between gratings, d is the spacing of the fringes and dmé is the Moiré fringe spacing.
Diode Lasers in Super-Resolution Microscopy:
As discussed above, diode lasers are indispensable in the field of super-resolution microscopy due to their unique properties and capabilities. They serve as the primary light source, providing the necessary illumination for various techniques. Their ability to generate precise and controlled light allows for the creation of grid projections in SR-SIM, the excitation and depletion of fluorescence dyes in STED, and the detection of emission from single fluorescent molecules in STORM and PALM. The polarization control they offer is crucial for achieving optimal interference patterns during the structured illumination process. In addition to their technical advantages, our Matchbox CW lasers are cost-effective and compact, making them an attractive choice for super-resolution microscopy. They can modulate at up to 10Mhz, enabling fast imaging capabilities without the need for signal averaging due to the high signal-to-noise ratio. Moreover, our wavelength combiners are able to integrate multiple wavelengths such as 405nm and 561nm which are essential in PALM and STORM systems, while maintaining their compact footprint.
Relevant Products
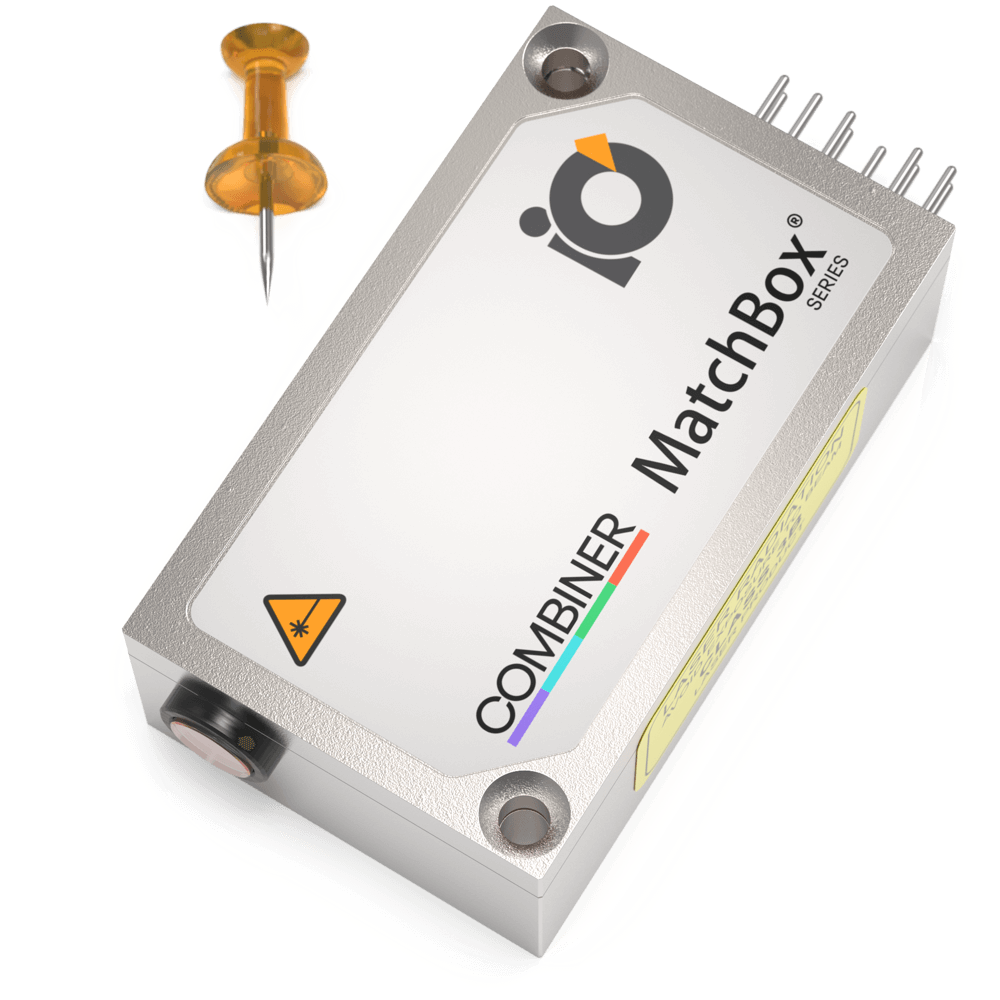
Multi-Wavelength Laser
488 nm - 40
638 nm - 130
Spectral line width FWHM, nm: 1
Power stability, % (RMS, 8 hrs): 0.2
Intensity noise, % (RMS, 20 Hz to 20 MHz): 0.5
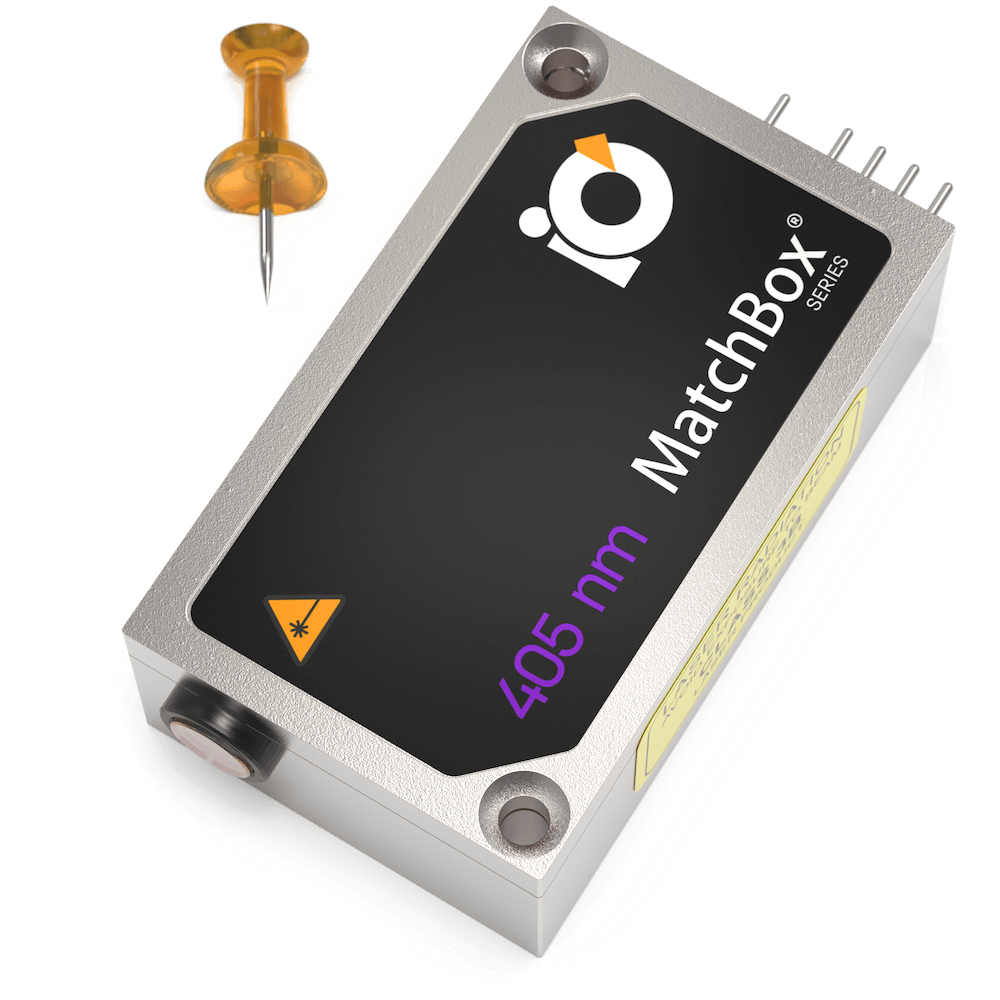
405 nm SLM Laser
Spectral line width FWHM, MHz: 20
Output power, mW: 50
Power stability, % (RMS, 8 hrs): 0.05
Intensity noise, % (RMS, 20 Hz to 20 MHz): 0.2
Multi-Wavelength Laser
488 nm - 40
520 nm - 80
638 nm - 130
Spectral line width FWHM, nm: 1
Power stability, % (RMS, 8 hrs): 0.2
Intensity noise, % (RMS, 20 Hz to 20 MHz): 0.5

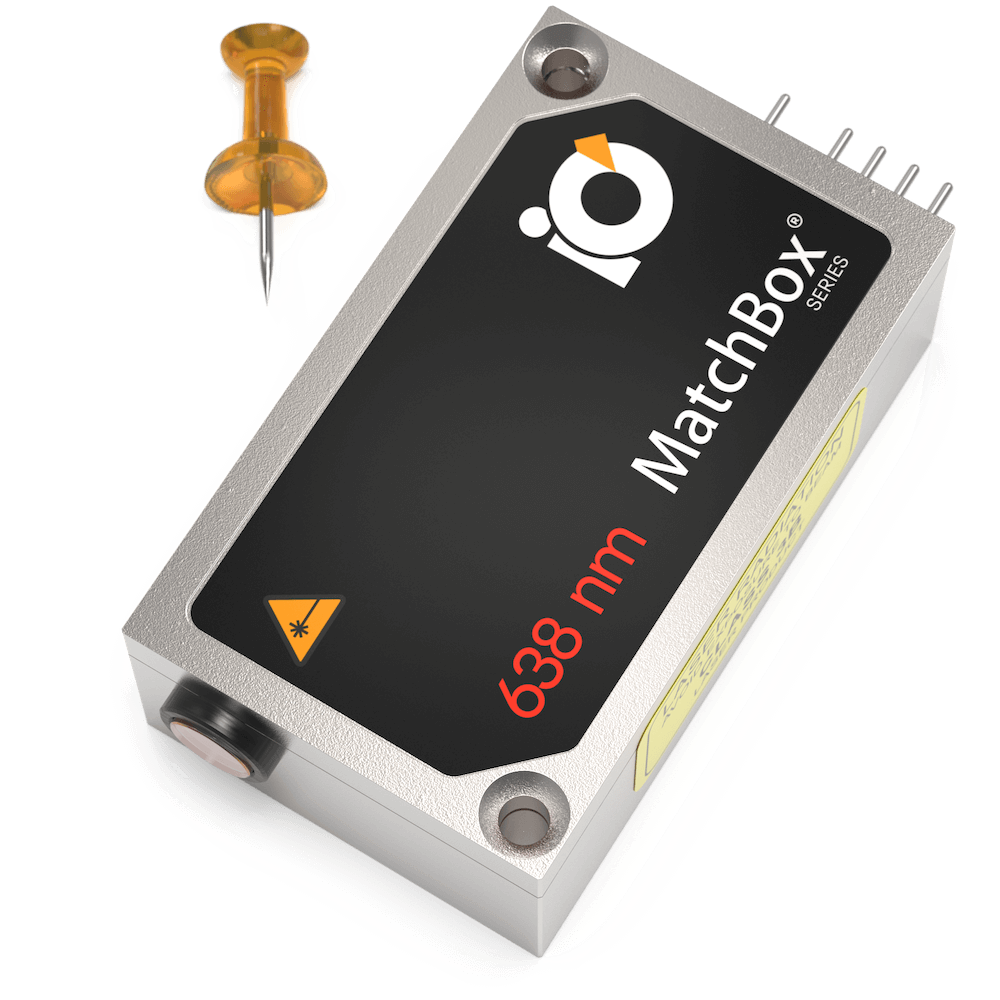
638 nm SLM Laser
Spectral line width FWHM, MHz: 2
Output power, mW: 100
Power stability, % (RMS, 8 hrs): 0.03
Intensity noise, % (RMS, 20 Hz to 20 MHz): 0.25
488 nm SLM Laser
Spectral line width FWHM, pm: 0.1
Output power, mW: 30
Power stability, % (RMS, 8 hrs): 0.05
Intensity noise, % (RMS, 20 Hz to 20 MHz): 0.1
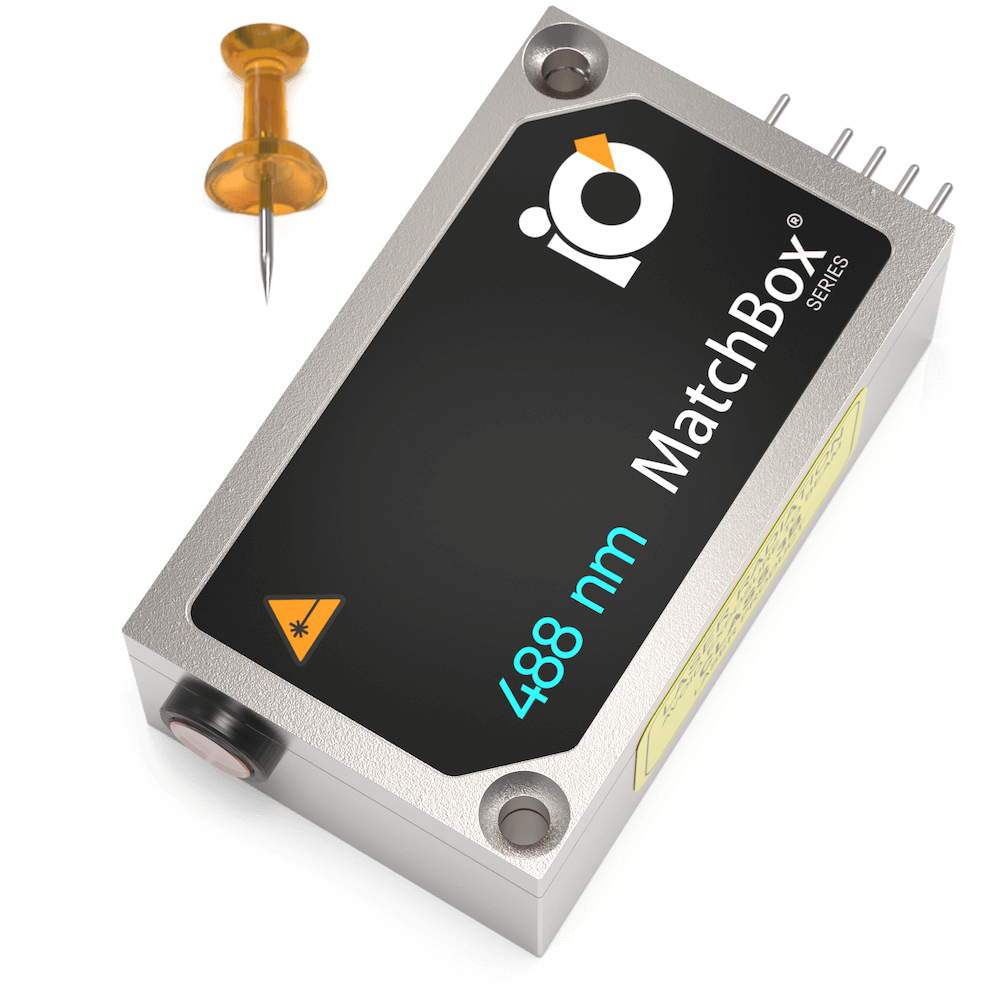
633 nm SLM Laser
Spectral line width FWHM, MHz: 2
Output power, mW: 70
Power stability, % (RMS, 8 hrs): 0.03
Intensity noise, % (RMS, 20 Hz to 20 MHz): 0.2
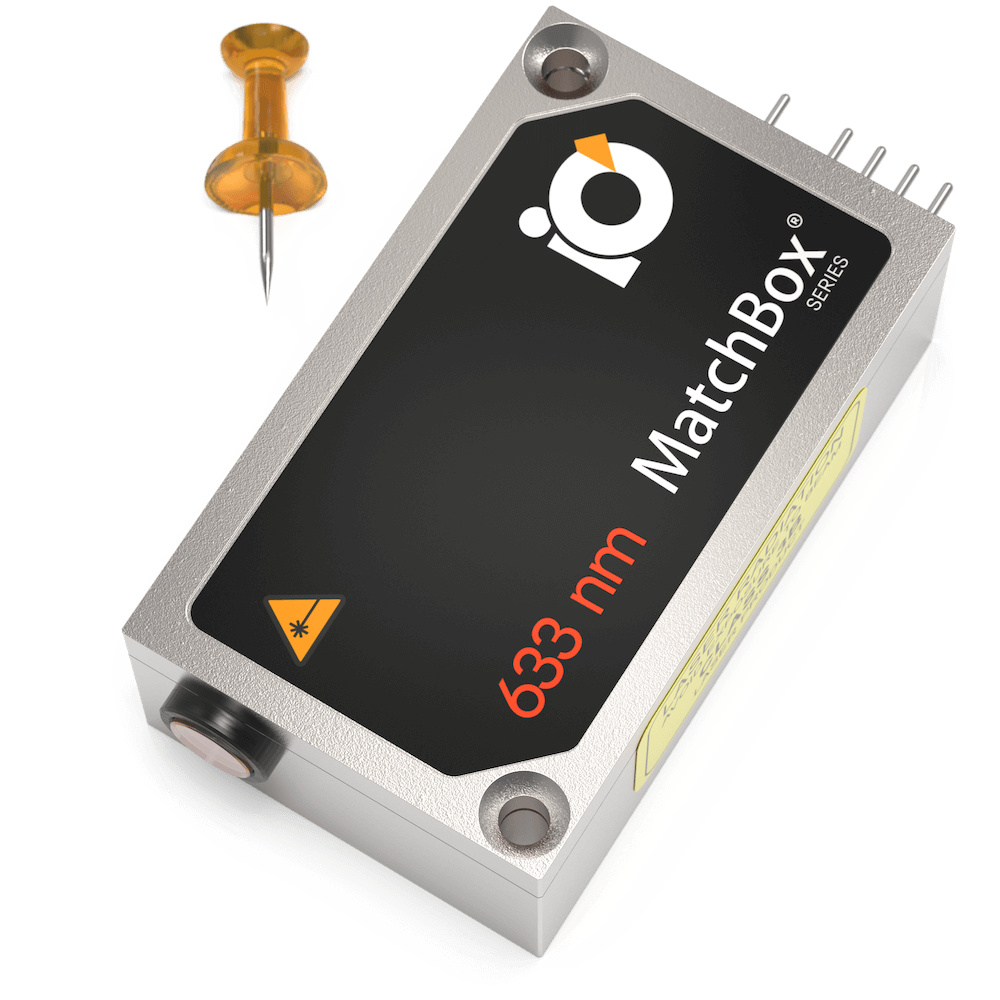
532 nm SLM Laser
Spectral line width FWHM, MHz: 2
Output power, mW: 50
Power stability, % (RMS, 8 hrs): 0.1
Intensity noise, % (RMS, 20 Hz to 20 MHz): 0.7
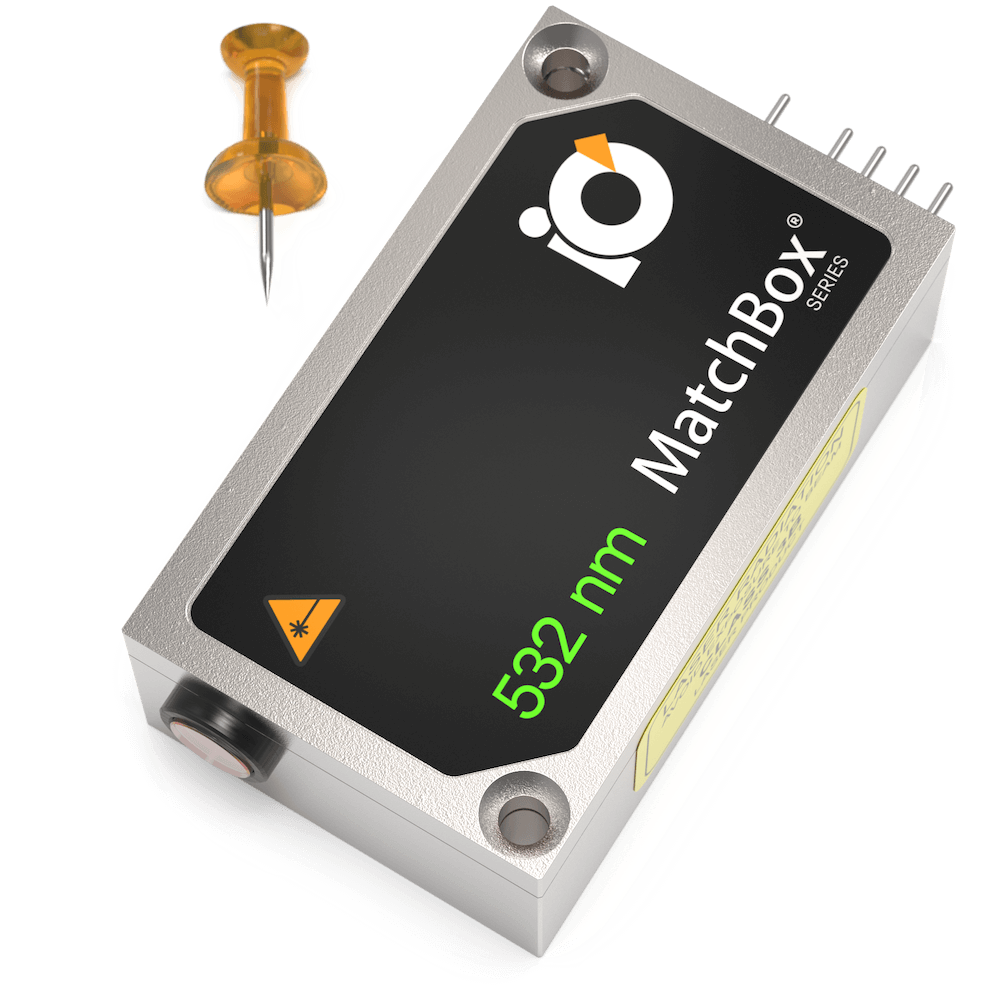
785 nm SLM Laser
Spectral line width FWHM, MHz: 2
Output power, mW: 125
Power stability, % (RMS, 8 hrs): 0.02
Intensity noise, % (RMS, 20 Hz to 20 MHz): 0.15
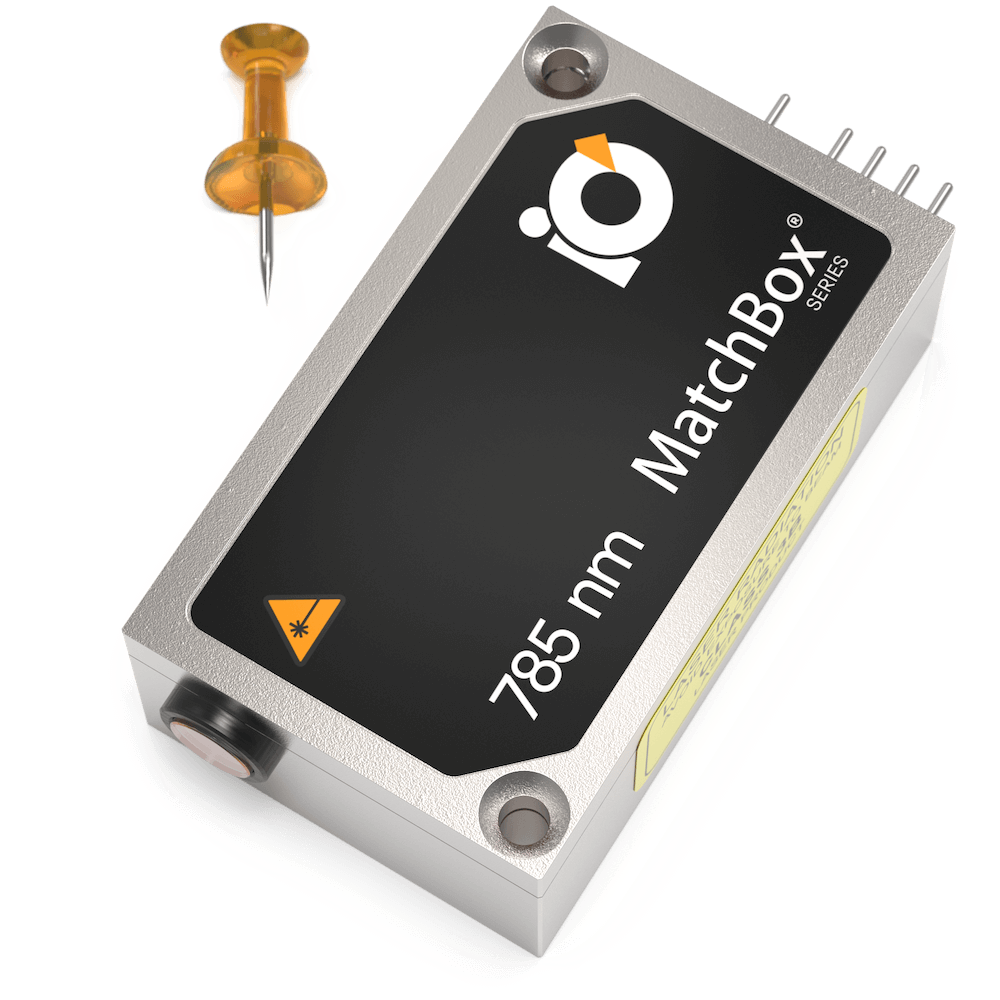
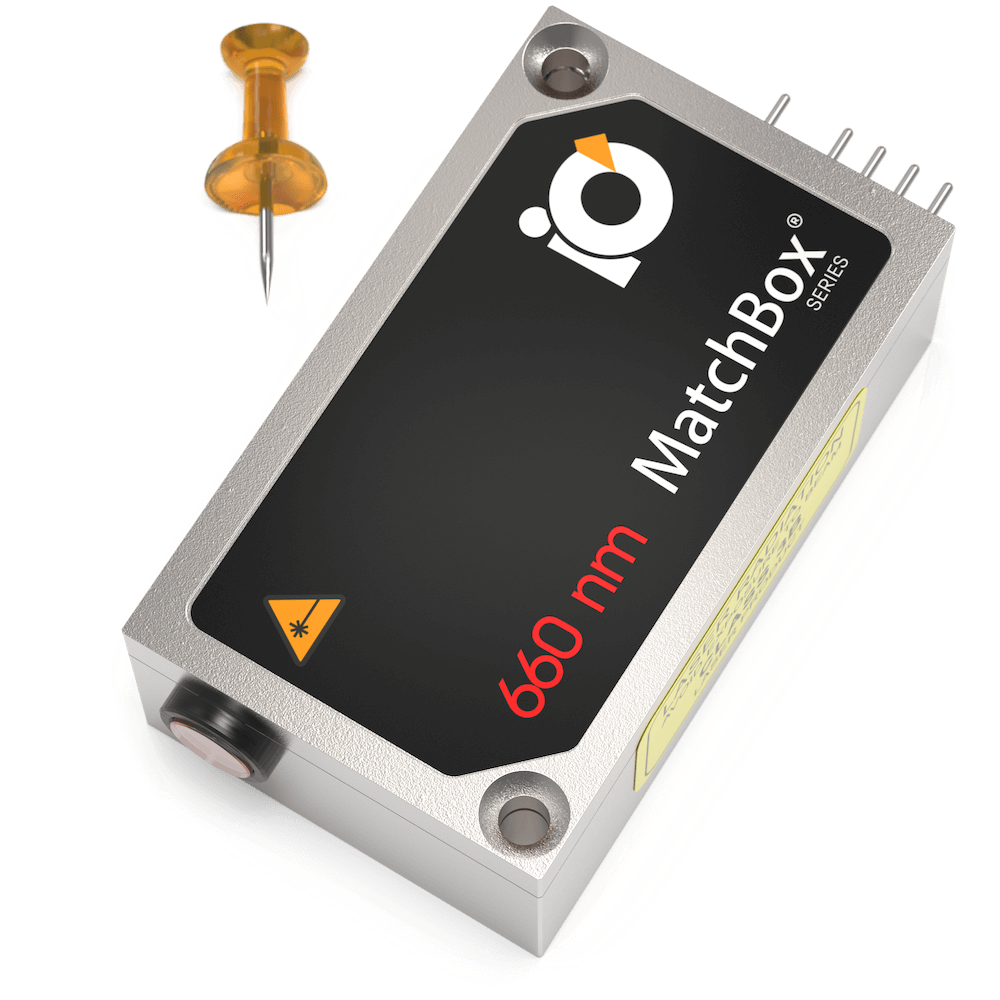
660 nm Laser
Spectral line width FWHM, nm: 0.7
Output power, mW: 110
Power stability, % (RMS, 8 hrs): 0.05
Intensity noise, % (RMS, 20 Hz to 20 MHz): 0.2
Publications
HardwareX: